The idea
Most Bitcoin charts show price in isolation. This one shows price against its Realized Price bands — a valuation framework (popularized by CryptoQuant and Axel Adler Jr) built on the actual on-chain cost basis of every holder. It answers a more useful question than “what’s the price”: where are we in the cycle, and is Bitcoin cheap or overheated relative to what holders actually paid?
🪙 Open the live chart · 💻 Source on GitHub
What it shows
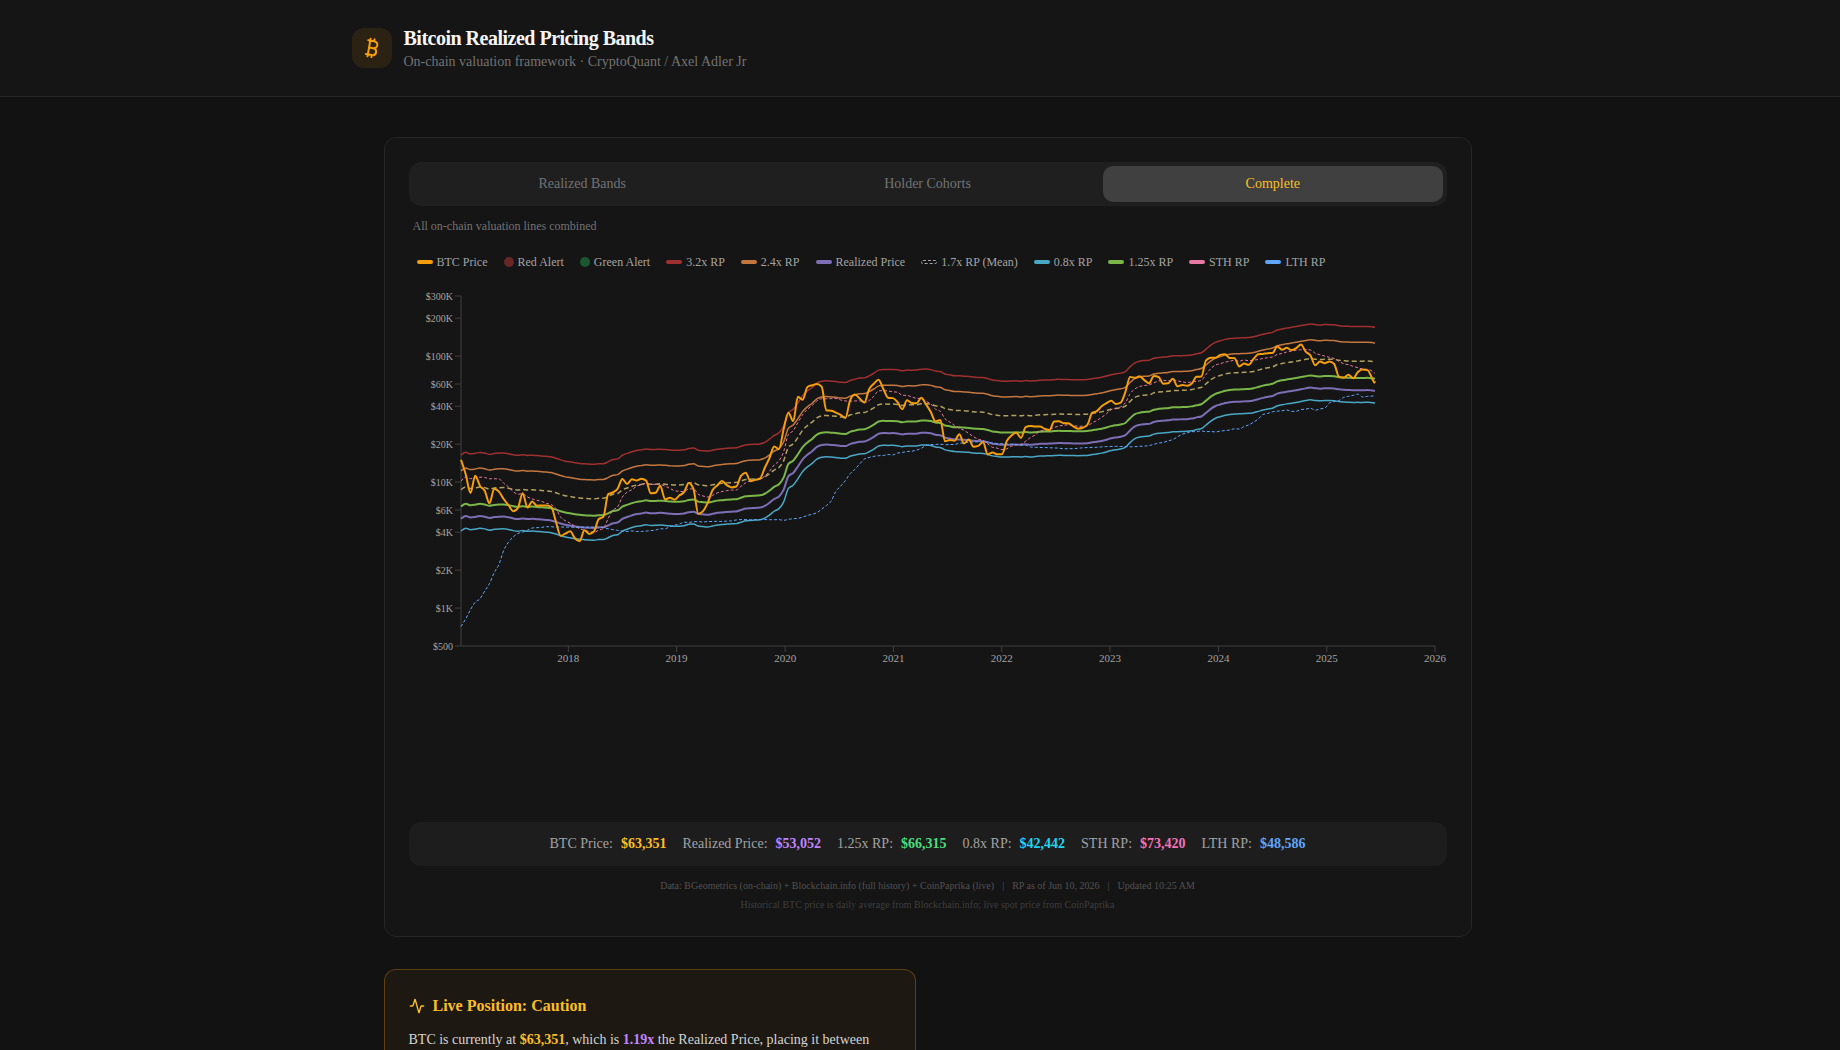
- Realized Price bands — six multiplier zones from 0.8x RP (deep capitulation) through 1.0x (cost-basis floor), 1.25x (the decision line), 1.7x (historical mean), 2.4x (euphoria) and 3.2x (extreme overheated). Each maps to historically meaningful tops and bottoms.
- Holder cohorts — short-term vs long-term holder realized prices (STH/LTH), so you can see what recent buyers paid versus seasoned holders.
- Live commentary — the page reads the current price against the bands and explains, in plain language, which zone Bitcoin is in and what it has historically meant.
- Three view modes — Realized Bands, Holder Cohorts, or the complete combined view.
How it’s built
All data comes from three free, public, no-auth APIs: BGeometrics (on-chain realized price + STH/LTH RP), Blockchain.info (full daily price history back to 2018), and CoinPaprika (live spot price). The aggregation logic — day-indexed lookups, band math, live-point stitching — runs entirely in the browser, so the whole app ships as a static site with no backend, no serverless functions, and no running cost. Built with Next.js, charted with Recharts, and deployed to Cloudflare Pages.
Not financial advice. This is a valuation heuristic for research and education. All data refreshes live from the sources above — always do your own research.